Get in touch with us
Whether you’d like to tell us about your project, meet us at an event, or
simply chat — we’d love to hear from you.
Whether you’d like to tell us about your project, meet us at an event, or
simply chat — we’d love to hear from you.


With Prime Day Campaigns
USA, Australia, Canada, UK, and Germany
Prime Day 2020 was no different – it marked the 2 biggest days ever for small- and medium- sized businesses, with over $3.5 billion in sales, a nearly 60% year-over-year increase. This doesn’t come as much of a surprise though considering the events closest ever proximity to the holiday season (62% of shoppers bought holiday gifts during Prime Day this year), as well as the estimated 5-year acceleration in ecommerce due to COVID.
What makes the difference between a brand that really knocks it out of the park and a brand that sees a mild lift? A comprehensive strategy that incorporates both on and off-Amazon marketing and advertising strategies. At VENDO, we recommend leveraging a blend of off-Amazon tactics (i.e. Paid Media, Organic Media, Email Marketing, SMS Marketing) as well as on-Amazon tactics (calculated Prime Day advertising plan, deliberate setup of Amazon deal types, and a strategic 3-phase deal structure aimed at leveraging the A10 algorithm leading in to – and out of – the main event).

Strategic Structure Pays Off:
Brands that had a lead-in and lead-out strategy (sales before and after the main event) saw jumps in sales during those days by as much as 67%.

External Traffic Drivers Pays Off:
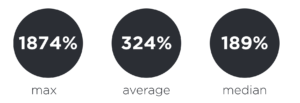
Brands that leverage external traffic drivers (i.e. paid media via Facebook and Instagram ads, organic media across social media, email marketing, SMS, etc.) saw sales growth as much as double. One brand in particular, went from 269% growth to 569% growth due to SMS marketing!


For 2 High-Value Keywords
in 1 Week
Of Ranking and Sales
Created
A health & personal care brand had a mouthwash they wanted to get to page 1 of Amazon’s search results for a highly valuable and highly relevant keyword, “natural mouthwash.” Why? To capture the increase in organic traffic and sales that come from having this higher position in the search results and thus capture market share from the competition.
We conducted research using various analytical tools and came to the understanding that competing products on page 1 search results for the keyword, “natural mouthwash”, sold on average about 300 units a week. Thus, we knew in order to achieve this ranking, we would need to ensure the brand’s product met or exceeded this sales velocity. By leveraging a 3rd-party platform of ready-to-buy Amazon customers, we were able to distribute 300 90% off discount codes over 7 days, thus “manufacturing” 300 real sales.
To maximize results, we also ramped up our advertising efforts (increased bids and budget; in particular, for the targeted keyword, natural mouthwash) and ensured the product page was designed to convert at a high rate (high quality images and infographics, enhanced brand content, optimized features, competitive review count/rating, and competitive pricing).
By the end of the 7 days, the brand’s product was fluctuating between positions number 1 and 5 on page 1 for “natural mouthwash”. Organic sales were coming in at 35 units/week, which marked 7x growth to what it had previously been getting – 5 units a week.
This major increase in organic sales velocity sustained several months into the future, thus launching the product onto Amazon in a very powerful way and creating a halo effect for other products in the brand’s catalog, as they too began to see incremental growth.
Fast forward over a year, and the product is still at the top of page 1 not just for the primary targeted keyword of natural mouthwash, but also for several other high-value secondary keywords (i.e. “whitening mouthwash”) as well.

Month-Over-Month Growth
On All Products
However, many Brands fail to recognize that they can lose the buy box due to lower pricing on channels outside of Amazon and so they fail to take the proper precautions to prevent this from happening. Amazon’s algorithm will search other marketplaces such as Walmart and Target to ensure the lowest price is listed on Amazon and if it doesn’t have the lowest price it will suppress the buy box accordingly.
When the buy box becomes suppressed the customer is forced to take the extra step of pressing “See All Buying Options” and must select from a list of sellers in order to add to cart. Not only do these few extra clicks cause conversions to go down, but the listing itself is not eligible for advertising. These two factors combined can cause a severe decline in sales.
Our brand partner was faced with this challenge because Walmart had unexpectedly reduced pricing for 40% of their products, and therefore Amazon suppressed the buybox for all products. At the same time, our partner had no ability to lower the Amazon price to match Walmart’s pricing to regain the buy box because their items were selling via a direct relationship with Amazon, namely VENDOR Central or 1P, so therefore Amazon set the pricing and typically matches the lowest price both on and off Amazon. Time was of the essence because the partner was transitioning to the third party platform or Seller Central (SC) from VENDOR Central (VC) and needed to deplete the VC inventory as quickly as possible as inventory was shipping into SC.
• VENDO’s Amazon team worked synergistically with VENDO’s Walmart team to work on resolving the issue.
• The brand partner’s past Walmart buyer contact was no longer in charge of the category. Through strong Walmart buyer relationships, VENDO’s Walmart team was able to identify the correct Walmart category buyer and arrange for a meeting to discuss solutions.
• After building the correct relationship, our team worked with the buyer to determine the amount of in stock units and negotiate options to solve the pricing issue.
Note: Correct Walmart inventory information is practically impossible to obtain without working through a buyer because Walmart’s system provides outdated numbers.
39% Month-Over-Month Growth
Regained Buy Box on All Products
The buyer offered solutions and our brand partner decided the quickest and most effective option for the situation was to initiate a buy back at cost for the remaining stock so there would no longer be any Walmart listings to compete with the Amazon listings.
The opportunity to work with Walmart again when the timing is right has been left open due to the positive interaction and relationship established with the buyer.
Regained the Amazon buy box on all products.

Bestseller
Reviews with 4.5 Stars
Unauthorized Sellers Removed
Counterfeit Products Removed
Top Dog Direct has been serving inventors and innovators for over 10 years. They specialize in finding, developing, and bringing new and innovative products to market. Starting with TV where the customer decides the winners, successes then quickly move on to intensive internet, catalog, and retail distribution, all based on all the huge TV awareness they generate. Their most recent success in Campbell Posture Cane has been revolutionary for helping people walk upright, as it supports the strength of your body to improve line of sight for balance, mobility, and comfort.
At VENDO, we helped launch Campbell Posture Cane on Amazon by creating listing optimization, paid media strategies, content creation, brand protection and promotional marketing.
• Best seller in wallking canes category
• 1000+ Reviews with 4.5 Stars
• 30+ Unauthorized Sellers Removed
• 30+ Counterfeit Products Removed
• #362 in Health & Household Category
• Amazon Choice Editorial Recommended
• FSA/HSA Eligible

Weekly Sales Growth
Sales greatly exceeded the previous monthly average
A health & personal care brand had been on Amazon for years, but sales had plateaued after reaching an average of $100K/month. VENDO was challenged with relaunching the brand on Amazon and growing sales.
Audit the entire Amazon Channel and find areas of opportunity for enhancement; for example:
○ Title
○ Features
○ Product Description
○ Enhanced Brand Content (EBC)
○ Image & Video Gallery
• Product Images
• Lifestyle Images
• Infographics
• Promotional Graphics
• Video
○ Back-End SEO
• Subject Matter
• Search Terms
• Other Details
○ Brand Store
○ Marketing; I.e.
• Coupons
• Cross-Promotions
○ Advertising
• Auto
• Manual
Branded Non-Branded Brand Store Headline Ads (aka “Sponsored Brand”) Product Targeting
Leverage internal proprietary processes plus 3rd-party software to conduct comprehensive market research and competitive analysis in order to create best-in-class optimized content that carefully balances the A9 algorithm + consumer conversion (target market) + brand image.
Created a 30-day timeline to execute on the implementation of these deliverables.
In just 1 month, sales grew from $105K to $211K
In the 4 days of Black Friday through Cyber Monday, sales were $101K — the same as the entire monthly average in the trailing 2 months

Increase in Sales after Year 1
of their Products are visible on page 1 or 2
of their Products became featured as Best Sellers
Star Increase in Average Review Rating
A beauty brand within the haircare category was not aware they were on Amazon. Their wholesale accounts resold their products on Amazon without their authorization.
By not having control of their brand on Amazon, the negative effects the brand encountered included:
• Incorrect description on their listing
• Low resolution or pixelated images
• Sold below the manufacturer suggested retail price
• Received expired or damaged products
• No customer support
The brand cut off all wholesale accounts and made VENDO their exclusive Amazon distributor and brand manager on Amazon for optimal control.
Optimized all listings, established customer service and review responses, increased non-branded presence on Amazon with sponsored ads.
Cleaned the channel by eliminating unauthorized sellers and removing duplicate listings.
Created the Brand Store, Enhanced Branded Content, and Infographics.
Created bundles and variety packs which added 30 additional SKUS and accounts for 30% of sales.
• 471% Increase in Sales After Year 1
• 15 of their Products are Visible on page 1 or 2
• 8 of their Products Became Featured as Best Sellers
• 1 Star Increase in Average Review Rating
• Sales Surpassed Their Total Wholesale Account Within 6 Months
• Increased non-brand Presence on Amazon with Sponsored Ads Optimization Strategy
• Improved Product Listing Ranking
• Eliminated 99% of All Unauthorized Third Party Sellers

Growth (for same week) vs. LY
Week-over-Week Growth
Year-over-Year Growth
Walmart held its’ first ever Summer Savings event July 2019 to mirror Amazon’s Prime Day event. One housewares brand we represent was asked by a Walmart.com buyer to present a compelling offer for the online event. We have maintained a great buyer relationship in this specific category, which is why we were pushed so hard to present a deal. Since the discount asked of us was so large, we needed to secure a PO large enough to make it worth the brands discount effort.
This partner in particular sells their items both on Walmart and Amazon so we had to plan months in advance to find a differing item that would not be discounted for Prime Day so the offer could be stand alone on Walmart. We secured a 10,000 unit PO in return for a 35% discount. For such a large PO in a 4 day discount period, the brand was required to blast out the deal on their respective social media channels while Walmart agreed to feature the item on their affiliate marketing lists as well as feature the item top of relevant searches and have special discount flags.
• Buyer relationship, seasonal planning, social media blasts from Brand and Influencers featuring the deal.
• Added site placement in the form of SKU boosts, catapults and banners.
• A feature in Walmart’s affiliate marketing list.
• 508% WoW Growth
• 25% YoY Growth
• Spurred a 25% increase in growth vs LY
• Up 810% vs LY Same Week
• 598% Growth vs LW
• Strengthened Buyer relationship Because of Participation and Set Stage for Better Holiday Planning and Access to Special Buys and Deals

More Orders on Amazon vs. Shopify
More Clicks on Amazon vs. Shopify
Higher Conversion Rate on Amazon vs. Shopify
More Sales on Amazon vs. Shopify
A prominent beverage brand wanted to see how many of their subscribers (many of which were direct customers from their online store) would purchase off of Amazon compared to their own online store.
The brand sent an email blast to its email subscribers promoting an $8/25% OFF New Year sale. In the email blast, the subscribers were given the option to shop — and purchase — off of either the brands direct-to-consumer online store, or their Amazon Brand Store.
The option to purchase on the online store was presented first in the email, while the option to purchase on Amazon was presented last.
• 450% More Order on Amazon vs. Shopify
• 13% More Clicks on Amazon vs. Shopify
• 33% Higher Conversion Rate on Amazon vs. Shopify
• 113% More Sales on Amazon vs. Shopify

Weekly Sales Growth
Attributable Sales Revenue from $0 Influencer Fees
on Amazon's Hot New Releases List
Return on Investment
A keto/protein/snack bar brand* had just launched into market and on Amazon. The brand wanted to drive brand awareness, have content created that could be repurposed, drive traffic to their online store and Amazon product pages, and of course, drive sales. They wanted to do this by providing the influencer with free product (aka a “product-for-post“ collaboration). However, for the influencers that performed well, they would then look to extend the partnership into a paid structure for future campaigns.
Using influencer data analytics software and internal strategies, we researched influencers on Instagram and YouTube that have:
• Audiences that resonate with the brand
• High engagement rates (5%+)
• Following of less than 50K, except for a few (micro and nano influencers)
After our research, we narrowed our list down to around 100 influencers. We then communicated with the influencers via branded emails and social media platforms and proposed a product-for-post collaboration.
Once the influencer exhibited interest in moving forward with a product-for-post collaboration, we negotiated the requirements (i.e. a 24-hour Instagram story, a static Instagram post that stays on the feed, an unboxing video on YouTube, a review video on YouTube, etc.) while also striving to ensure the influencers content would be as authentic as possible.
In order to elevate the experience for all involved (the influencer, the influencers audiences, the brand, and the brands audience) we created unique, branded, and photo-friendly packaging for the protein bars. We also created a custom insert with a hand-written note and a custom 30% off discount code for the influencer to share with their audience.
• 194% Weekly Sales Growth
• 11K+ Attributable Sales Revenue from $0 Influencer Fees
• #2 on Amazon’s Hot New Releases List
• 2650% Return on Investment
• 11K+ Attributable Sales Revenue from $0 Influencer Fees
• Influencer Selection
We ended up reaching agreements with 18 total influencers (15 from Instagram and 3 from YouTube)
• The average followers were 18K on Instagram and average subscribers were 250K on YouTube
• The range of followers on Instagram were 3K to 41K
• The range of subscribers on YouTube were 3K to 733K
• Drove Nearly 50% of All orders
Within 2 weeks of the campaign going live, 46% of total orders (190 out of 411) were attributed to influencers. Because the brand was a startup and did not anticipate such a massive flood of orders, they actually sold out and had to begin taking pre-orders for when their next production of product was ready.
• Continued to Drive Pre-Orders
One month after the campaign went live and the product sold out, orders continued to come through on pre-order with a great majority of those orders being attributed to the influencer campaign.
• Category Winners on Amazon
The products 3 flavor variations reached #2, #3, and #5 on Amazon’s Hot New Releases list for the Protein Bar Category and #19 and #20 overall on Amazon’s Best Sellers list for the Protein Bar Category. Prior to the influencer campaign, the products were ranked around #150.
• Increased Sale by Nearly 200%
Within 2 weeks of the campaign going live, weekly sales had increased 194%
• Resulted in a 2650% ROI
2 months after the campaign went live, the ROI was measured at 2650%. Since the influencers were paid with product and not a fee or commission, the only costs were the cost to make the product, the packaging, the handwritten cards, and the shipping.
• Content Creation
The influencers gave us their video and photo content so that we could repurpose it across our marketing channels. Some of this content was very professional and authentic, thus replacing the need – and cost – for a professional photoshoot.
• Influencer Performance
The one aspect that all of that these top-performing influencers had in common was that their niche was closely aligned with the niche of the brand.The top performing influencer (Youtuber with 733K subscribers) drove 180 orders, the second highest performing influencer drove 12 orders (Instagram influencer with 36K followers). In addition, 5 other influencers drove sales ranging between 1-5 units.
Influencer Niche Matters! The one aspect that all of that these top-performing influencers had in common was that the niche as the brand.
*For example, somewhat separate from this specific campaign, we had also gifted 3 Instagram influencers with followers ranging from 170K to 1 million. While these influencers clearly had large followings, they did not drive any sales because they were not in a close enough niche as the brand.


